

Ex-sell side/buy side. Spent years writing research nobody read on stocks everybody owned. Now writing research people actually want on stocks nobody covers.
England, United Kingdom
Joined March 2026
- Tweets226
- Following331
- Followers2.2K
- Likes299





The irony is that the people who understand the commercial problems best are being restricted from building solutions to them.
The real disruption from agentic coding isn’t making engineers more productive. It’s allowing domain experts to become builders.
AI dramatically reduces the cost of creating software, yet institutions seem determined to preserve the organisational bottlenecks it was supposed to eliminate.
Manage the risks, absolutely. But governing who can build, rather than what can be deployed, seems like fundamentally the wrong abstraction.
The firms that figure this out will have a considerable advantage.


The full paper is worth reading. A summary, plus a few thoughts on applying it.
The argument
GAAP earnings spread costs over time through accruals and depreciation, but value depends on when cash actually moves. Their worked example is a factory project that reports positive net income every year but has a negative NPV on its cash flows. The point isn't that earnings are useless, but that they can mislead on value creation, particularly where pay is tied to EPS.
The evidence
They rank stocks monthly on trailing FCF yield, using a 45-day reporting lag, across the Russell 1000, 2000, 3000 and MSCI World. Yields are normalised by industry, and by country for MSCI World, so the test compares companies with their peers rather than sectors with each other.
Results are consistent across all four universes. In MSCI World (1996–2024), the top quintile returned 9.8% a year and the bottom 4.1%, against 7.2% for all stocks. The lowest-yield quintile was also the most volatile in every universe.
Some context
Returns are equal-weighted and exclude transaction costs, which the authors note.
The effect is larger in small caps.
A good part of the spread comes from the bottom quintile underperforming, so the measure is useful for screening out names as well as finding them.
The top quintile lagged from 2017 to 2020 before recovering.
Trailing FCF growth also carried information, though less consistently than yield.
Applying it
The study uses reported FCF. In practice I'd adjust for a few things:
Share-based compensation, which is a real cost but is added back in cash flow
Lease payments, which IFRS 16 reclassifies as financing and which matter a lot for retail, restaurants and travel
Growth versus maintenance capex
One-off working capital movements
Combined with a view on returns on capital and how management allocates the cash, it's a sensible starting point for valuation work.

I've seen a lot of debate on Shaun's SpaceX ($SPCX) model,so here's my two cents.
First, credit where due. His 2020 Starlink model, built when Starlink had zero revenue, had it at a ~$23bn run-rate by end-2025. It's at ~$20bn now. That's a remarkable call. And the wood-for-the-trees camp is right that taxes and working capital are noise. Novel businesses need first-principles forecasting, not extrapolation.
But here's the irony. Terrestrial compute is $569bn of his $731bn 2028 revenue (~78%). That's the least futuristic thing SpaceX does: renting GPUs in data centres on Earth. And unlike Starship or orbital compute, it has observable market prices.
So let's engage on his terms. He says compute is a commodity, SpaceX is the low-cost producer, and rev/GW and capex/GW move together.
In a commodity, the low-cost producer wins on cost, not price. And if scarcity reprices the whole market to $40bn/GW, Oracle earns it too on $37bn of capex. That's a boom for everyone, not distress that SpaceX can buy cheaply.
His 2028: $40bn revenue per GW, $30bn capex per GW
Oracle (Investor Day): $16bn revenue, $37bn capex
CoreWeave (reported): ~$7bn annualised revenue per active GW
So SpaceX is modelled as the low-cost producer AND charging 2.5x Oracle's price.
The coupling doesn't fix it. At Oracle's $16bn price, his ratio implies ~$12bn of capex per GW. Nvidia says its own share alone is ~$25bn/GW on Blackwell and ~$40bn on Rubin.
And his own 2026 numbers show capex of $40-55bn per GW, so the cost advantage is still a forecast.
Starship is an extraordinary moat in launch. It doesn't help sell compute in a Texas data centre at 2.5x market.
Genuine question: if compute is oil, why does SpaceX get 2.5x the oil price?

Over the last week I built a bottoms up SpaceX financial model through the end of 2028
The numbers that came out are insane
There are wide error bars given how quickly things are changing but I wanted to distill something complicated into something that can at least be debated
* This is not investment advice!!!
** Sequoia is a major SpaceX shareholder
*** Past performance is not indicative of future results

Read the whole thing over coffee, really good piece of work. Hashing the tests before looking at outcomes and publishing the ones that failed is more rigour than most sell-side or buy-side backtests ever get.
The bit that made me laugh was the rules of thumb making the model worse. Half the industry's earnings-morning process is basically a list of those, so that one stung a bit.
A few things I've been chewing on from a UK small/mid cap angle:
A lot of UK names don't put out a classic earnings release. Half the reporting calendar is trading updates with a line on full-year expectations and no proper P&L. Did those end up in the European sample, and did the model handle them as well as full results? I'd guess the expectations packet matters even more there.
On the after-hours point in the limitations, in the UK most of this happens at 7am RNS with nothing trading until 8, so you've got a clean hour where the call could actually be used before any price exists. Feels like a better test bed than the US for the live season.
And the 93% on confident "much bigger" calls is great, but on 57 calls I'd want to see how wide that interval is before anyone builds a process around it. Would be good to see it hold up in the live run.
Looking forward to the next one.

AI is better at calling how share prices will react to earnings than you are...
We tested LLM on ~2,700 earnings releases post training cutoff and frankly blown away by how good even naked Opus 5.5 was at calling share prices correctly.
Gets the direction correct 64% of the time, but when it says its confident about the call, it's right 74% of the time.
Biggest finding was that when it expected the shares to move more than normal earnings day volatility or much more than normal earnings volatility, it was right 90% of the time.

ALT Using LLMs to predict earning share price reactions.
I'm starting a weekly series going back through the special situations in famous investor letters and rebuilding the numbers myself. First up is from Buffett's 1960 partnership letter.
The business
Sanborn made incredibly detailed maps of every US city for fire insurers. Water main sizes, hydrant locations, roof materials, building by building. For about 75 years it was effectively a monopoly. Profitable every year, recession-proof, no sales force needed.
Then in the early 1950s insurers started using a cheaper underwriting method called "carding". Map profits went from over $500k a year in the late 1930s to under $100k by 1958.
The business needed no capital, so from the 1930s Sanborn had been putting retained earnings into stocks and bonds. About $2.5m went in. By 1958 it was worth roughly $7m, or $65 a share.
The stock was $45.
Compare that to 1938. Stock at $110, portfolio worth $20 a share, so the market was paying +$90 a share for the map business. Twenty years later, with the Dow up about 5x, it was valuing the same business at -$20. You were being paid to own a business that still made money.
Of 14 directors, nine came from the insurance industry. Between them they owned 46 shares out of 105,000. The insurers were Sanborn's customers, not its owners, and had been net sellers of the stock for a decade.
The portfolio doing well took away any urgency to fix the core business. Dividends were cut five times in eight years. Buffett notes he couldn't find a single suggestion to cut salaries or directors' fees.
So you had a hidden asset, a board with no skin in the game, and a shareholder base that had given up.
The son of a former president quit after being refused the top job. Buffett bought his mother's ~15,000 shares, then built the position to ~24,000 (with associates) in the market, about 23% of the company. Two other unhappy blocks lined up with him, taking the group to 46,000 shares, roughly 44%.
He joined the board and pushed to separate the portfolio from the map business. Rather than a proxy fight, they agreed a deal: any shareholder who wanted out could swap their stock for portfolio securities at fair value. The SEC signed off.
About 72% of the stock took the exchange.
The clever part was the structure
If Sanborn had sold the portfolio and paid out cash, it would have owed corporate capital gains tax on ~$4.3m of gains. At 25% that's about $1.1m, or ~$10 a share. Handing over the securities in kind avoided it entirely. Buffett puts the tax eliminated at over $1m.
The holders who stayed kept the same map profits spread over about 28% of the shares, so EPS went up roughly 3.5x, plus a bond reserve of $1.25m+.
The numbers
I rebuilt it in Excel.
Base case, per share:
Share price: $45.00
Portfolio: +$20.00 to $65.00
Latent corporate tax: -$10.30
Map business at 10x earnings: +$9.52
Value even if sold and taxed: $64.23
Tax saved by the exchange: +$10.30
Intrinsic value: $74.52
The letter doesn't give Buffett's entry price. Assuming around $45 and an exit at $65 through the exchange, that's ~44% over roughly 1.75 years, or ~23% a year, on a position that was 35% of partnership assets. In 1960 the partnership made 22.8% while the Dow lost 6.3%.
And the downside: with the map business at zero, the portfolio could fall ~30% before you lost money.
What I'm taking from it
1. The best asset plays hide in balance sheet lines that P/E screens never see.
2. Check board ownership. 46 shares out of 105,000 tells you most of what you need to know.
3. Cheap isn't enough. Someone has to force the value out, or there needs to be a clear path to it.
4.Structure can be worth as much as the discount. Here the tax saving was about half the size of the discount itself.
5. Liquid assets beat a turnaround story as downside protection.
Where does this show up today? Holdcos, family-controlled companies sitting on cash or listed stakes, businesses where the operating company is valued below zero.


Really interesting evolution of your thinking, particularly on financial modelling. I suspect this is where one of the biggest opportunities for AI in investing lies.
One missing link, though, is the connection between research intelligence and the actual investment decision.
Identifying a potential regime shift is one thing. Understanding how new evidence should change the probability of that shift, how those changing beliefs propagate through financial forecasts, and whether the resulting valuation differs from what the market already discounts is quite another.
I’d love to see us move towards a more systematic, continuously updating investment process:
Evidence → Belief revision → Causal/temporal modelling → Valuation → Market-implied expectations → Investment decision.
Crucially, with a feedback mechanism that evaluates whether our original hypotheses, causal assumptions and forecasts were actually correct.
The interesting implication is that the financial model doesn’t disappear. It becomes the quantitative bridge between what we believe about a business and what we’re prepared to pay for it.
And perhaps the real competitive advantage won’t come from who can process the most information, but from who can most effectively convert information into differentiated, calibrated beliefs and ultimately better decisions.
That feels like a much more ambitious application of AI than simply automating the research process.
There's been a lot of discussion recently about AI replacing equity research analysts, mostly on the back of how quickly it can now build a linked three-statement model.
Having worked on the sell side and now the buy side, I think the impact will be more uneven than that.
Model building and note writing are a relatively small part of a sell-side analyst's job. A lot of the value comes from conversations with the buy side. Some analysts are most useful for explaining a complex sector, some for their proximity to the companies they cover, and many for their sense of how other investors are positioned. That last one matters a lot. You regularly see stocks move against the direction of earnings revisions, and positioning and sentiment usually explain more of that than the numbers do. That understanding comes largely from talking to people.
AI will change parts of the role. Sector education is probably the most exposed, since investors can now get a reasonable grounding on their own. Analysts who use the tools well should also be able to move faster on first takes and data work, which leaves more time for deeper research and expert conversations.
The roles I'd expect to shrink are the support functions, particularly offshore model building and maintenance, and possibly some broader headcount given research budgets were already under pressure.
One open question is training. A lot of analysts learned how businesses work by building models as juniors. If that work is increasingly automated, firms will need to think about how they develop the next generation.
AI capex is now a bond market story.
US IG issuance hit a record $1.76tn on Oct 27, passing the 2020 pandemic borrowing peak. AI spending is the main driver.
USD IG issuance from the core AI nine ($AMZN, $GOOGL, $META, $MSFT, $ORCL, $AVGO, $NVDA, $IBM, $AMD):
2023: $16bn
2024: $30bn
2025: $128bn
2026 YTD: $203bn
That's 12.5x in three years. Ten $20bn+ IG deals have priced this year, versus 11 in the prior seven years combined.
The market is absorbing the supply, but at a price.
AI-linked IG spreads have gone from 56bp to 91bp YoY. Non-AI IG has only moved from 74bp to 78bp.
Credit is charging a growing premium to fund the build-out.
All of these are investment grade, yet 10Y OAS ranges from:
GOOGL 81bp
AMZN 84bp
NVDA 100bp
AVGO 142bp
META 152bp
ORCL 265bp
The market is separating companies that fund capex from cash flow from those that fund it with leverage.
Further down the stack: CoreWeave bonds issued at ~9.7% in June were yielding ~15% by mid-October.
Equities see an AI rally. Credit sees a rising cost of financing it.
Today's spread tightening after SK Hynix is relief, not resolution. The supply overhang remains.
UK Budget day. Everyone's watching gilts and GBP, but the more interesting read-through is UK consumer mid-caps.
October 2024: employer NICs rose from 13.8% to 15%, and the threshold fell from £9,100 to £5,000. Labour-intensive consumer and leisure names fell 5 to 8% within days. The market wasn't reacting to the tax itself; it was reacting to the operating leverage.
Take a business where staff costs are 25% of sales and the EBIT margin is 8%. Every 1% rise in the wage bill is roughly a 3% hit to EBIT before any pricing response. At a 5% margin, the same 1% costs about 5%.
The pass-through argument also looked weak at the time. Full recovery needed price rises above 5%, while sector pricing had rarely exceeded CPI by more than 2 percentage points in two decades.
November 2025: the reverse. Expectations were so depressed that milder-than-feared business rates changes triggered a relief rally in retailers and pubs, and domestic mid-caps outperformed the next day.
So the lesson isn't "Budgets are bad for UK consumer stocks." It's that the reaction depends on the gap between the outcome and positioning, and that labour intensity determines the size of the move.
Going into today, I'd want to know:
– How much incremental wage inflation is already in FY27 consensus?
– Who has shown real pass-through since April 2025?
– Is positioning closer to Oct 2024 (complacent) or Nov 2025 (braced for the worst)?
Interested in how others are framing it.
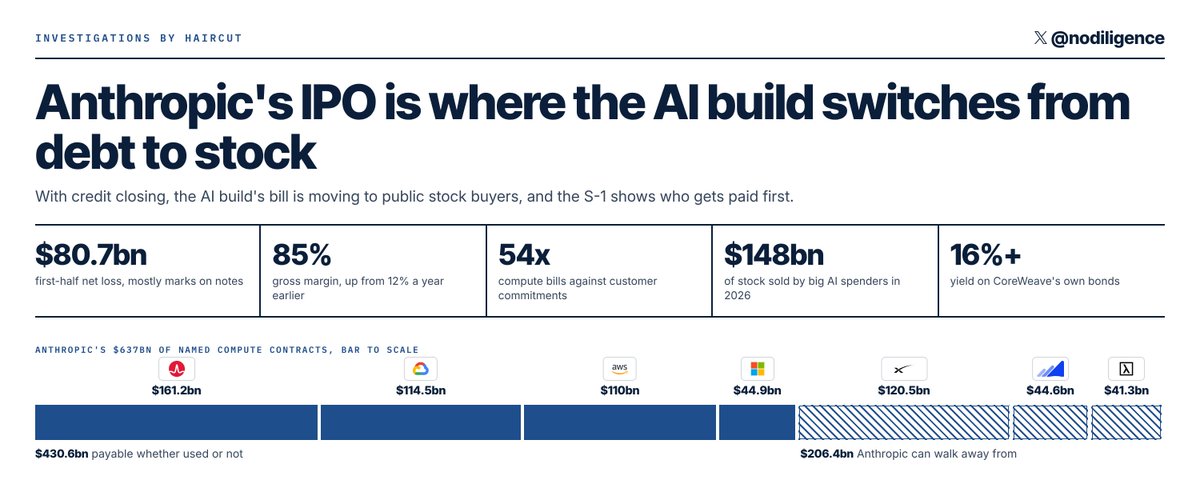
This is the most useful thing I've read on the $ANT S-1. Some thoughts below
Follow the balance sheet, not the asset.
The strongest idea here is that the cost of money in the AI build depends less on the GPU than on whose balance sheet stands behind the cash flow. The same exposure prices very differently depending on whether a hyperscaler or a chip vendor sits in front of it, and the structures that reached investment grade did it by borrowing someone else's credit. It's a simple lens, and it sorts the whole supply chain well.
Equity as the marginal funder is plausible, but it depends on rates.
The OP argues that credit is tightening and public equity is filling the gap. I find that persuasive for the most levered parts of the chain. I'm less sure it describes the lab itself. On the numbers in the piece, its operating cash flow comes in well ahead of its capex. To my eye the strain sits more with whoever lent long against short contracts. The OP is also clear that lower long yields would weaken the thesis, and I think that's the right test.
The build now feeds back into its own cost of capital.
If AI capex is big enough to show up in the inflation central banks are fighting, it pushes up the yields that price the long-dated debt funding the next round. That loop matters more than any single model launch. It also means most of the market will feel this through the 10-year rather than through chip stocks.
Settling compute in stock links usage to supply.
A growing share of the compute bill can be paid in shares at a discount to trailing prices, and the suppliers have registration rights to sell. That ties how much compute gets used to how much new stock comes to market. It reads less like a backlog and more like a dilution schedule, and I think it's the least discussed part of the filing.
The listing turns a private mark into a public one.
Once the stock trades, its price feeds into the reported earnings of some of the biggest index weights. That link between a single IPO and index-level earnings is new, and I don't think it's widely appreciated yet.
What needs watching:
- whether new neocloud contracts get longer or stay short
- whether vendor receivables keep growing faster than revenue
- Q3 gross margin in the amended filing, which shows whether the first half was flattered by rationed supply
- the 10-year rate
I'm keeping an open mind. The demand side looks good. The open question is who carries the funding risk, and this piece makes a seriously strong attempt at answering it.

I think you’re looking in the right place, but I’d frame the risk slightly differently.
The $800bn+ of compute commitments aren’t unrecognised losses. They’re multiyear obligations against future capacity, and Anthropic ($ANT) has already demonstrated GAAP operating profitability in Q2.
What interests me more is the mismatch between largely fixed compute commitments and usage-based revenues. H100 spot rental prices have been rising while Anthropic token pricing indices have been falling. Neither is a perfect proxy for Anthropic’s actual unit economics, but the divergence is interesting.
The question is whether improvements in compute efficiency can consistently outrun the deflation in the price of intelligence, particularly when Anthropic is committing capital years ahead of demand.
You can be entirely right about exponential AI adoption, and even Anthropic’s revenue trajectory, but still be wrong about the investment if the incremental returns on that capital are inadequate.
That’s the more interesting debate for me. Not whether AI demand materialises, but who ultimately captures the economics of serving it.


My initial S-1 thoughts:
As I expected, Anthropic is still firmly unprofitable. But, to their credit, they've significantly reduced compute costs as a % of revenue, leading to much narrower losses. On first look, there is a plausible and imminent path to profitability. This is impressive.
However, the meat of the document begins at page 161, under "liquidity and capital resources." There, we learn where the true compute costs have been hiding: future compute purchase agreements.
As of June 30, Anthropic has signed roughly $587 billion in compute leases and minimum purchase commitments that haven't begun. It has since signed $245 billion more, resulting in more than $800B in future compute costs. None of these costs have made their way onto the income statement yet. But they will, and when they do, the profitability picture will look completely different.
Anthropic acknowledges how precarious these agreements are. They point out that their compute providers (on whom they also rely for financial support) also sell services that "compete with ours." As a result, these providers/competitors may eventually force them into onerous agreements. This is something I've expressed concerns about for a while, and it's nice to see Anthropic openly recognize it.
That's why Anthropic admitted their most significant strategic decision: They're about to initiate "substantial capital expenditures." So far, they've spent zero. Why the change? Because they know they can no longer rely on leasing compute, "the magnitude and timing" of which are "inherently uncertain." So, they're going to build their own compute, which will, in their words, "change the cash flow profile of our business." I.e. make it severely negative.
It's possible that this is why they want to go public now. Since these costs have not yet "come online," they can be left as footnotes at the bottom of the document. But very soon, that won't be possible.
In sum, Anthropic's income statement is not telling you the full picture. To the company's credit, they spared us the accounting gymnastics of stripping out training costs in their non-GAAP adjustments. That would have been offensive. Still, the most important numbers aren't getting the requisite attention.
I encourage you to start at page 161 for a more complete understanding of what's going on.
uncoveredalpha retweeted

My initial S-1 thoughts:
As I expected, Anthropic is still firmly unprofitable. But, to their credit, they've significantly reduced compute costs as a % of revenue, leading to much narrower losses. On first look, there is a plausible and imminent path to profitability. This is impressive.
However, the meat of the document begins at page 161, under "liquidity and capital resources." There, we learn where the true compute costs have been hiding: future compute purchase agreements.
As of June 30, Anthropic has signed roughly $587 billion in compute leases and minimum purchase commitments that haven't begun. It has since signed $245 billion more, resulting in more than $800B in future compute costs. None of these costs have made their way onto the income statement yet. But they will, and when they do, the profitability picture will look completely different.
Anthropic acknowledges how precarious these agreements are. They point out that their compute providers (on whom they also rely for financial support) also sell services that "compete with ours." As a result, these providers/competitors may eventually force them into onerous agreements. This is something I've expressed concerns about for a while, and it's nice to see Anthropic openly recognize it.
That's why Anthropic admitted their most significant strategic decision: They're about to initiate "substantial capital expenditures." So far, they've spent zero. Why the change? Because they know they can no longer rely on leasing compute, "the magnitude and timing" of which are "inherently uncertain." So, they're going to build their own compute, which will, in their words, "change the cash flow profile of our business." I.e. make it severely negative.
It's possible that this is why they want to go public now. Since these costs have not yet "come online," they can be left as footnotes at the bottom of the document. But very soon, that won't be possible.
In sum, Anthropic's income statement is not telling you the full picture. To the company's credit, they spared us the accounting gymnastics of stripping out training costs in their non-GAAP adjustments. That would have been offensive. Still, the most important numbers aren't getting the requisite attention.
I encourage you to start at page 161 for a more complete understanding of what's going on.
There are a few things worth unpacking.
First, the underlying economics are changing much faster than their analysis acknowledges.
Anthropic ($ANT) generated $4.6bn of revenue in FY25. In H1 2026 alone, it generated $16.3bn.
More interestingly, its cost of revenue fell from ~60% of sales in FY25 to ~15% in H1 2026, implying an 85% gross margin.
The company even generated $974m of GAAP operating profit in Q2.
That is a remarkable improvement. But we need to be careful about what it means.
Anthropic separately expensed $9.7bn of R&D in H1 2026. And unlike a conventional software company, a meaningful proportion of that expenditure is arguably necessary just to maintain its competitive position.
The distinction between the marginal cost of serving an existing model and the total economic cost of remaining at the frontier is enormously important.
It’s quite possible to have attractive inference economics while earning much less attractive returns on the capital required to continuously develop better models.
Second, and more importantly, I have a problem with their treatment of future compute commitments.
New Constructs deducts $518bn of contractual commitments from enterprise value when arriving at its equity valuation.
But future purchase commitments are not necessarily equivalent to financial debt.
If I contract to purchase $100bn of compute over the next decade, and that compute enables me to generate $150bn of revenue, I cannot simply capitalise the operating profits generated from that activity and then deduct another $100bn from my valuation.
The cost of the compute should already be reflected in my forecast operating cash flows.
Otherwise, it’s counting the same economic obligation twice.
There are exceptions. Finance leases need to be treated consistently as financing obligations, and uneconomic take-or-pay contracts can absolutely destroy equity value.
But the S-1 distinguishes between purchase commitments, leases that have not commenced, and additional infrastructure agreements. These have different accounting and economic characteristics.
Treating the gross undiscounted commitments as one enormous liability is not an adequate substitute for modelling their cash flows.
Third, I tried to replicate their reverse DCF.
They assume a 9.33% WACC, substantial upfront revenue growth, and reinvestment equal to 50% of incremental sales in the early years, declining to 15%.
Under a consistent 2% terminal-growth assumption, I can get remarkably close to their $1.1tn and $144bn scenarios.
But their headline $2tn scenario, which assumes a 10% NOPAT margin and 56% revenue growth from 2028–35, produces approximately $1.6tn in my reconstruction.
And there’s a more fundamental point.
The claim that Anthropic must generate $3.6tn of revenue by 2035 to justify a $2tn valuation is not some mathematical inevitability.
It’s the output of a particular set of assumptions about margins, reinvestment, discount rates and terminal economics.
Change those assumptions and you change the implied revenue requirement substantially.
Fourth, I think the S-1 actually reveals a more interesting bearish thesis.
Anthropic’s revenue is predominantly consumption-based. Customers can increase or reduce their usage as their requirements change.
But the company is simultaneously entering into enormous, multi-year compute commitments, some of which contain take-or-pay provisions.
And its infrastructure strategy is increasingly shifting towards arrangements requiring substantial capital investment before the associated compute even becomes operational.
Think about that mismatch.
Future supply is being committed years in advance against demand that is much less contractually certain.
If demand continues compounding and compute efficiency improves faster than pricing declines, Anthropic could generate extraordinary operating leverage.
1/ 👇

Worth a read $ANT
I always respect David's opinion on IPOs, even if I don't agree with them.
"There’s 40%+ Downside If Growth Slows, Even with Higher Margins"
"There’s 90%+ Downside If Anthropic Generates the Same Profit as Meta"

But what happens if model competition compresses pricing, customers shift towards cheaper alternatives, or the economic useful life of compute infrastructure proves shorter than anticipated?
The same fixed commitments that create operating leverage on the way up could become a significant liability on the way down.
And importantly, the company’s H1 operating cash generation tells us relatively little about the economics of infrastructure commitments that have yet to commence.
To me, this is where the real investment debate lies.
Not simply whether token prices are declining. Not whether the company is currently profitable. And certainly not whether future compute purchases can be labelled debt and deducted wholesale from equity value.
The questions I’d want to underwrite are:
1. How much revenue and gross profit can Anthropic generate per dollar of committed compute?
2. How quickly do inference costs decline relative to realised pricing?
3. What proportion of R&D is genuinely discretionary versus economically necessary to maintain frontier capabilities?
4. How much capital must continually be reinvested to defend its competitive position?
5. What happens to cash returns if utilisation, pricing or customer demand disappoints?
Ultimately, this is a return-on-invested-capital question.
I think New Constructs is asking the right question, but its DCF risks giving investors a misleading sense of precision.
Anthropic could become one of the most consequential businesses in the world and still be a poor investment at $2tn.
Equally, it could face enormous capital requirements and still generate attractive shareholder returns if incremental compute investment earns sufficiently high returns.
Those are not contradictory statements.
The mistake is confusing extraordinary industry growth with extraordinary business economics or assuming extraordinary capital requirements necessarily preclude them.
The S-1 provides evidence for both sides of that debate.
What it doesn’t provide, at least not yet, is enough evidence to confidently determine which side ultimately wins
There's a related Charlie Munger idea here: never confuse a favourable outcome with a good decision

It's interesting that private equity guys, once known for being among the most clear-eyed / ruthless / street-smart class of professionals in "elite" corporate america, are now perhaps among the most naive. I have this theory that the warped incentives private equity benefited from over the past 15 years created an entire generation of "elite" financial professionals that are completely epistemically compromised. Good times create weak men, etc. etc.
One-pager: Evolution (EVO SS). Cheap, but not yet asymmetric
This came out of a screen of European consumer names with market caps of €3–20bn. I was looking for companies trading below their own history while estimates hold up. Evolution passed the first test clearly and the second one partly.
The numbers (SEK 841, 26 Oct)
CY27 P/E of 12.5x vs a 5-year average of 17.5x
CY27 EV/EBIT of 10.9x vs a 5-year median of 14.1x
FCF yield of about 7.6% on consensus, after all capex and lease payments
Adjusted EBITDA margin of about 66%
Net cash of about €0.5bn, or close to zero if you treat the net current tax liability (about €0.4bn) as debt-like, which I do
What looks priced in
A 7.7% FCF yield on EV implies roughly 1% perpetual growth at a 9% cost of capital. A rough sum of the parts gives the same answer. Value everything outside Asia at 15x EBIT, and the market is paying about four years of profit for Asia.
What's actually happening
Q3 revenue grew 3.7%, the first year-on-year growth in five quarters
North America, LatAm and Africa make up about 30% of revenue and are growing in the high teens or more
Europe revenue is down about 14% over eight quarters, though it was flat in Q3
Asia, about 37% of revenue, has been flat at €190–198m a quarter for five quarters
About 49% of revenue comes from markets the company classifies as regulated
Risks
Asia and compliance. A company-commissioned review (Spectrum, 2022, disclosed in US litigation) found Evolution's games were played in prohibited markets because of compliance deficiencies. The company's position is that operators choose their markets. The risk I'd weigh most is not local enforcement but licensed regulators treating this as a suitability issue. The UK settled with Evolution as a supplier in 2026, which sets a precedent.
Brazil. The studio closed after the provisional ban, and the incumbent president was re-elected on 25 October, so I assume a prolonged loss.
Estimates. CY26 EPS consensus is down 5% over 12 months, though flat over three.
The Street. The median price target (SEK 725) is about 14% below the share price.
Cash flow quality. Reported operating cash flow benefits from tax deferral: tax paid was €75m in 2025 against a €184m charge.
Shareholder structure
Kenneth Dart's Candle Lake holds about 34% after a mandatory bid at SEK 695, which was below market. I read that as a floor, not a takeover premium. Buybacks keep increasing his stake and shrinking the free float.
Risk/reward
Bull, SEK ~1,100: Asia holds, Brazil reopens, 15x CY27 EPS
Base, SEK ~910: consensus EPS at 13.5x
Bear, SEK ~545: Asia down 25%, no Brazil, 10x
The probability-weighted value is SEK ~870, about 3% above today.
Probability-weighted R/R is 1.3x against my 3x hurdle. It clears at around SEK 760, or at today's price only if you're confident the SEK 695 bid holds as a floor.
Conclusion: watchlist, not a position. It's a cheap, highly cash-generative business, but at this price the downside scenarios aren't well enough protected.


Having lived in both the US and Europe, I can absolutely attest to this.
I think the mistake people make is comparing gross salaries rather than the cost of replicating the same quality of life.
The US unquestionably offers greater earnings potential, particularly in certain professions. But once you factor in housing, healthcare, childcare, transport and, importantly, the value of your time, the equation changes quite dramatically.
And it’s not as though London is particularly cheap either.
But the broader point resonates. Once you’ve experienced a lifestyle where more of your time is genuinely your own, you start to appreciate that not everything can be solved by earning another $100k.
At some point, the marginal utility of another dollar is worth considerably less than the marginal utility of another hour with your family.

An interesting theme lately in the American expat community in Western Europe, especially higher earning corporate types (e.g. €200-300K/year), is the feeling of being unable to move back home to the US.
Few reasons...
Many who moved in the years after COVID sold their homes when rates were closer to zero than the rates now. Now that same home is ~20% more expensive while mortgage rates are 2x higher. So the monthly cost of housing like-for-like went up literally 100% in just 3-5 years.
They've gotten used to the European way of life (e.g. no or maybe just one car, easy train and airport access) and its far less intense commercial and career culture... so fewer working hours and more vacations and significant employee protections (i.e. hard to be fired legally).
This is great while living in Europe... a €250K household income is massive even post-tax considering the low relative cost of health care, education, transport, housing, etc...
...but dropping themselves back into US society... especially in a major metro area like NY, SF, Chicago, even Miami now... at age 40-50 with kids... is largely impractical.
Many Europeans would be shocked to learn that ~$250K/year in the US is incomparable to that same level of earnings in a major Western European city like London or Amsterdam or Paris.
I'd estimate the income needed in the US to match the overall quality of life you'd enjoy in one of those European cities... is around $500-750K/year.
Wild.
Luceco (LUCE LN): some notes on why I think the market is pricing a one-year problem as a permanent one.
For anyone unfamiliar: Luceco makes everyday electrical products for UK homes and buildings. That covers sockets and switches (BG), consumer units, lighting, Masterplug extension leads and, increasingly, EV chargers. Most of it is made in its own factory in Jiaxing, China. FY25 revenue was £271m and adjusted EBIT £33.8m. About 60% of sales go into residential repair and improvement, and only 5% into new-build housing.
The near-term issue is copper. In sterling terms it averaged about £7,550/t in 2025 and is running at about £10,200/t for 2026, up roughly 35%. The forward curve is flat at around £10,700/t through 2028.
Luceco hedges, so FY26 has been largely protected. H1 gross margin held at 41.9%, and guidance is for adjusted EBIT ahead of £40.9m. My estimate is about £43m. The company has met or beaten opening-year consensus every year since 2019, by around 5% on average.
FY27 is where I think the numbers are too high. I back-tested gross margin against copper, CNY and freight over FY19–25. The best fit has most of a copper move hitting the P&L about a year later, with only 20–40% recovered through price in the year itself. On that basis FY27 gross margin falls from about 41.7% to about 39.3%. I get FY27 EBIT of about £41.6m, against Bloomberg consensus of £43.3m, which still has profit growing.
The 2021 rally is a useful reference. Copper rose about 41% in sterling. Gross margin fell 2.7 points that year and another 1.1 the next, then fully recovered by 2023 as pricing caught up. I expect a similar pattern, with FY28 EBIT rebounding to about £50m.
So my view is below consensus for FY27, but I think the share price already reflects something worse.
At 202p the stock is on about 9x FY27 EV/EBIT using my below-consensus numbers, with about a 7.7% FCF yield. That compares with a five-year average of 9.9x and a peer median of about 11.9x. On a simple reverse DCF (10.4% WACC, 2% terminal growth), today's price implies either:
an EBIT margin of around 11% indefinitely (12.5% in FY25), or
revenue growth of around 2.5% a year to 2030 (9.6% a year over FY22–25).
A few other points matter beyond copper:
Outgrowth: Luceco has grown about 4 points a year faster than its end markets, based on ONS construction output weighted to its own mix. That excludes 2022, when customers destocked and Luceco fell 20% while the market grew. In H1 26 the gap was about 3 points.
EV chargers: EV charging and Demand Flexibility have gone from about £10m of revenue in FY24 to about £34m this year, roughly 11% of the group.
Management talked about c.75k chargers for 2026. Demand Flexibility income per charger was cut in Q3, so I model it at a much lower level from FY27.
Returns: ROIC is mid-to-high teens, which puts it with Volution and Howden rather than the lower-returning UK building-products names it trades alongside.
New CEO: Dr Thorsten Müller, ex-Halma, took over in September. His stated focus is capital allocation and a leaner structure, with a strategy update due at the March 2027 results.
Things that could make me wrong:
UK rates and housing: RMI turns down in 2027 as rate expectations rise. Mortgage approvals are already down about 16% from April.
Demand Flexibility: further regulatory changes to flexibility payments.
Copper: it keeps rising, or price increases don't stick.
Destocking: a repeat of the 2022 trade destock.
Supply overhang: EPIC/ESO (28%) and the founder have been selling shares.
The other direction: Luceco simply beats again and FY27 is fine.
Probability-weighted, that's about 277p, or around 37% above the current price.
The bear case deliberately combines a destock with a further copper rise in the same year.
The likely flashpoint is FY27 guidance at the March results. If that comes in below consensus, I'd expect it to be the low point for sentiment rather than the start of a longer decline.


Having reached Director on the sell side before making the move to the buy side, I think this is very good advice.
One thing I’d add is that the skills that make you successful at one stage of your career aren’t necessarily the ones that make you successful at the next.
On the sell side, you can be an exceptional analyst, but as you progress, the job increasingly becomes about building a franchise, developing client relationships, generating commercial value and managing people. Being a great stock picker isn’t necessarily what makes you a great MD.
Equally, moving to the buy side requires a different skill set. Having a good investment thesis is one thing. Translating that into a position, sizing it appropriately, managing risk and knowing when you’re wrong is another entirely.
My advice would be to spend less time looking at the titles of people above you and more time understanding what they actually do every day. Then ask yourself whether that’s a job you’d genuinely enjoy doing for the next 10–20 years.
And don’t confuse being capable of reaching the next rung with it necessarily being the right rung for you.
There’s a lot to be said for knowing what game you’re best suited to play, rather than simply trying to climb the highest.

Once you hit the 2nd year associate level in finance you should have an honest conversation about what type of work you can do for the rest of your career.
Aka, examining your competency. What you want to do should = what you CAN do. Try answering the following:
What are you actually good at, how intense of a shop do you want to work at, where do you want to live, do you want to be buyside, do you want to work in the private markets or public markets, equity or credit, are you talented enough to become MD/VP, do you want to do AI instead, do you want to buy a SMB in the future, will you get promoted here, are you actually good at your job/are the other ppl your age better than you etc.
What’s important to remember is not everyone becomes an NFL head coach. Theres only 32 head coaches. 32 offensive coordinators, 32 defensive coordinators. Not all coordinators are suited to become a head coach and the same thing is applicable in finance.
One thing I’ve learned covering restaurants is that perfectly rational decisions at the company level can produce some fairly irrational outcomes at the industry level.
Take store expansion. One operator identifies an attractive catchment and opens a restaurant. A competitor responds because it doesn’t want to surrender market share. Both have perfectly reasonable arguments for investing.
A few years later, the catchment has more restaurants than it probably needs, volumes are spread across too many sites, and neither operator is earning quite the return it originally anticipated.
I’ve been wondering whether we’re watching a much larger version of this play out in AI infrastructure.
For Microsoft, Google, Amazon and Meta, the consequences of underinvesting could be enormous. If AI becomes the next major computing platform, losing your position today might be exceptionally difficult to recover from.
So everyone keeps investing.
Individually rational. Collectively, perhaps not.
Now introduce Jevons’ paradox. As inference gets cheaper, consumption should increase. But I think there’s a tendency to jump from that observation to the conclusion that the current infrastructure buildout must therefore generate attractive returns.
I’m not sure that necessarily follows.
Token consumption, revenue and returns on invested capital are three very different things. Usage could explode while falling prices and improving hardware productivity undermine the economics of providing that compute.
There’s also an interesting asymmetry in the timing. The companies supplying the chips, power and equipment can enjoy exceptional economics during the buildout, even if their customers ultimately struggle to earn an adequate return on that infrastructure.
Which brings me back to the original question.
Are hyperscalers investing because the economics justify it, or because the strategic consequences of not investing are simply too great?
I suspect the answer is some combination of both.
But the distinction matters enormously if you’re trying to work out where the economic value from AI ultimately accrues.
