

Finally, kick-ass charts to build confidence in your trades. SPY / QQQ / BTC nightly. Chart requests in discord. |West Point '98| https://nitter.gq/t.co/qGxEJnOiUQ
Joined March 2009
- Tweets17.5K
- Following633
- Followers6.1K
- Likes26K






Pinned Tweet
You won't believe this....
Sure, I post charts and price targets here. But there's thousands more (literally) in the Discord.
Membership gives you:
- 30+ daily charts with measured moves and fib targets
- Your chart requests (every request - every day).
- Re-charting on higher or lower timeframes for you based on how you're trading the chart.
- Premium Tradytics, OpenBB, Unusual Whales Bots
- See my trades. I don't post them for you to copy; I post them real-time so you know I'm not full of BS.
Trade all day; chart all night.
bit.ly/chartsunchained
$SPY $QQQ $BTC $NVDA $TSLA $AAPL $META $MSFT $NFLX $GOOGL $SMCI $MSTR


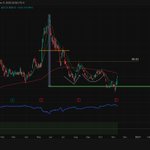
$NBIS: It took 4 months from the confirmed candle close below the neckline in July to finally make it to the measured move below in November.

1
679
“If a man can’t manage his own life, he can’t manage a business.”
S. Truett Cathy (founder of Chick-fil-A)
4
650


$SPY gaps up and hits the 20d EMA brick wall.
If the big boys are gonna short, then this is likely where it happens.




Tighten those stops!

Will seasonality and cyclical tendencies bail the market out as we head into two of the stronger months of the year?
UPDATE: On October 15, I added the $SPY short to our portfolio in anticipation of a general market decline. At the time, the position was initiated as a hedge against our long exposure.
Since then, the market declined, with the $QQQ falling 11% and the $SPY declining 5% from our entry price (short). That weakness stopped us out of all but one of our long positions ($TEVA) - either at small losses or with profits on stocks where we had backstopped gains.
By default, as our long exposure came down, the $SPY short transitioned from being a hedge to leaving us net short the market.
We view the recent action as a stealth bear market in certain areas, where the major indexes have masked significant deterioration beneath the surface, particularly among AI infrastructure and technology stocks. Many of those names have suffered substantial declines from their highs, driving them to oversold levels.
My original stop on the $SPY was 778.00, which represented a new all-time high only about 1% above our short price. I have now improved that stop to our breakeven price of 769.64, eliminating stop-loss risk on the position.
The trade has already been a success from a risk/reward standpoint. We initially risked approximately 1%, while the $SPY declined roughly 5% from our entry—about a 5R move.
Our decision to hold for a potentially larger move was based first on the position serving as a hedge and, subsequently, on our ability to de-risk the trade to the point where we now have zero principal risk.
This is a classic way I approach many of my market/ETF trades when shorting the general market.
minervini.com
minerviniprivateaccess.com


"Under promise and over deliver"
No. On Wall Street, it's "over guide, walk down, then beat!"
Historically, the average walk down of earnings guidance is 4%. In other words, the final earnings guidance estimates going into the beginning of earnings season are about 4% lower than when the estimates first came out months earlier. Throughout the quarter, analysts and companies walk down those original guidance estimates so that when the actual earnings are released, the estimates are beat!
Ironically, the the average quarterly beat is 7%. So, if you compare the actual earnings to the very first guidance numbers, (before all the walk downs), the average quarterly beat would be ..... 3%.
Right now during Q3 earnings season, the average beat is 2.7%. If we look at the revisions, this quarter is unusual in the sense that instead of a walk down, we experienced a walk up of 1.4%, meaning that the bar was raised throughout the quarter instead being walked back. So, the true Q3 2026 earnings beat this quarter is 2.7% +1.4% = 4.1%.
So why is the market pulling back? Because the market likes to be lied to. Even though the actual beat is 4.1% vs 3%, the nominal beat is only 2.7% vs. 7%.

Analysts always underestimate expectations heading into reporting season. Comparing the quarter-end estimate to today shows how inaccurate Street estimates are

1
3
529
Have you heard that we are in a "negative equity risk premium" environment?
What does that mean?
When you invest in equities, you should demand a premium over the yield you would otherwise earn with a risk-free investment, (e.g., the 10-year Treasury note). If the 10-year Treasury note is at 5%, (the current rate), that means the money you could make risk-free is 5%.
You could park your money right there and not worry about losing your basis, and you will collect 5% annual interest payments for 10 years. (The only risk you take in this investment is called duration risk; the only way to guarantee you receive your exact original basis is by holding it for all 10 years, which is a worst-case scenario.)
If you want to make more than a 5% yield, you would naturally look for an investment in equities. The question you need to ask yourself is: "How much of a premium over 5% do I expect in exchange for taking the risk of putting my money in equities and risking losing my basis if the market pulls back?"
The answer to that question is different for everyone. Maybe you want to make 1% more, maybe 20% more. Whatever the number, you want to make something north of 5%.
So, what sort of yield can you expect from the S&P 500 earnings right now? Something north of 5%? No. The S&P 500 earnings yield is only 3.9%.
Put these two numbers together and you can see that the 10 year Treasury yield of 5% is greater than the S&P 500 earnings yield of 3.9%. The additional premium you get from investing in equities vs. bonds is negative (3.9% − 5.0% = −1.1%).
In the chart below, I’ve graphed the opposite of the risk premium by subtracting the S&P 500 earnings yield from the 10 year Treasury yield. This shows me when bond yields are superior to equities.
This is only the fourth era in the last 100 years where bonds are not only yielding a safer return than equities; they’re also yielding a better return. Right now the 10 year note is yielding more than 1% over the equity earnings yield.
This doesn’t mean I’m suggesting you throw all your money at bonds. What this means is that as we’ve now entered a new regime where the spread is greater than 1%, you would do well to do some research on bonds to understand how they work, entries/exits, the different attributes, maturities, and duration risk.
$SPY $SPX $TNX $TLT


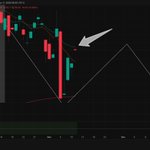
$HIMS: Descending Triangle break down and measured move price target attainment.

Options Johnny retweeted

To all Active Duty Military and Veterans: please accept our invitation to get a FREE Original Double Steakburger, Beef Tallow Fries and a Patriot Shake on Wednesday, November 11.
Thank you for your service! 🇺🇸

It's about to get real

Opinion -- pull back in yields (30-Yr touched 5.22%) is over. Sub 5.0 unlikely. Next stop 6.5-7.0% $ZB_F $US30

4
574
Options Johnny retweeted
Hey @HeinzTweets CEO, why do Europeans get the best-quality ketchup while Americans go without?
We tried to bring your superior European recipe (real sugar, incredible taste) to the U.S. Instead, you're pushing "Simply Heinz" — but it just doesn't taste as good.
Heinz is a great American brand. Why are you giving Europe a higher-quality product than the one you offer to your own home country?
Stop forcing us to look elsewhere for a replacement. Do the right thing for American diners. 🇺🇸🍅