

Maps, data, journalism @Oregonian | @mujschool grad | MS Cartography/GIS Dev @uwmadisongeog | Your creature comforts aren’t the only things worth fighting for.
Portland
Joined January 2007
- Tweets7.8K
- Following2.6K
- Followers2.1K
- Likes865








The gambling site said something I don't like someone call the cops

This makes sense to who??? Do something about it. They don't even hide it anymore. @DOJFraudDiv @FBIDirectorKash

3
66
Tell me about this conspiracy that involves more than 3,000 county officials all over the country acting in perfect lockstep and in complete secrecy right in front of the Trump DOJ

It’s not like 2020 where they cheated in 100 different ways in select locations. 2026 they basically applied the same weighted factor across the whole county. This is more than obvious!!!
3
113
do u know how population growth works

So what I’m supposed to believe happened in Texas is…
Democrat Hinojosa (Gov) in 2026 got the most votes of any election in Texas State history.
Democrat Johnson (AG) in 2026 got the second most votes of any election in Texas State history.
Democrat Rosenthal (Railroad) in 2026 got the third most votes of any election in Texas State history.
Democrat Goodwin (Lt Gov) in 2026 got the 4th most votes of any election in Texas State history.
Republican Abbot (Gov) in 2026 got the 5th most votes of any election in Texas State history AND LOST.
Yeah sure, that totally happened.
1
2
170

Much easier to believe that 254 county clerks conspired together right under AG Paxton’s nose than that people are just super pissed off because they can’t afford food or gas or health care

No shade but you’ll pardon some of us if “Christian nationalists not understanding basic Christian orthodoxy” has been on our bingo card since they put Tony Campolo through a heresy trial in the 80s

Christian nationalists not understanding basic Christian orthodoxy about the nature of God was on my bingo card.

1
2
159
Mark Friesen retweeted

@grok how many dumbasses have you humiliated on this platform when they ask this same question? 🤣🤣🤣🤡🤡🤡

So he shared this bullshit. Really reading the post-election room. The Trump administration spending the next two years bumbling around with brain-dead election theories from internet randos is a Dem's wet dream.

65


This is how they *prevent* fraud! You have until Nov. 24 to resolve the problem! This is the system working!

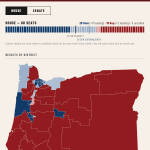
Just got an email from Oregon Secretary of State that there was a problem with my mid-term ballot. To call them to find out what the problem was so I can fix it so my vote counts.
They already declared the winners.
In Oregon - if you don't vote blue, they just don't count your vote.
2
148
What happens when you don't pay attention in math class is that you mistake a normal variation for conspiracy. They range from 65.1 to 66.1. A standard deviation of 0.38. Perfectly reasonable in a Democratic state with heavy straight-ticket voting.


Speaking as a computer scientist...
Note also that the numbers you referenced aren't all just 64-35, they're all 64.6 + or - 0.2, and 35.4 + or - 0.2. That's even more unlikely.
This is what happens when you don't pay attention in math class. Likely some corrupt programmer put in a random factor that he thought would alter the numbers, without making it look like it altered the numbers. Like (brain-dead example) "If this ballot was for the opponent, and the random number generator is greater than 0.6, then change it.". But he didn't bother to do the math, or he would have realized that if you use whatever that random element is, over enough cases, then the result converges on 64.6 and 35.4.
At least if I was going to vet the program that did this, then that's what I'd most expect to find. This is a typical undergrad mistake. Just because your algorithm has a randomizing element, that doesn't mean that the result isn't going to converge, over a large enough number of trials.
Also note that this kind of manipulation almost always leaves a footprint in the data. Statisticians who specialize in analyzing voting results know what properties honest results should have. Unless the corrupt programmer really knew what he was doing, they'll spot the strange results, and the nature of the strangeness will give them a strong clue as to what the programmer did.
So what we're doing now is:
California: *Heavy straight-ticket voting*
Truthers: Numbers too similar! Rigged!
Texas: *Heavy split-ticket voting*
Truthers: Numbers too different! Rigged!

HOLY CR*P 🚨 How is this even possible??
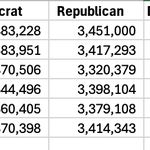
All of California’s major candidate election results are the EXACT SAME percentages for Democrats and Republicans
Governor 64% (D) vs 35% (R)
Lieutenant Governor 64% (D) vs 35% (R)
Secretary of State 64% (D) vs 35% (R)
Controller 64% (D) vs 35% (R)
Treasurer 64% (D) vs 35% (R)
Attorney General 64% (D) vs 35% (R)
Supreme Court Justice: Joshua Groban 72% (D) vs 28% (R)
Supreme Court Justice: Kelli M. Evans 72% (D) vs 28% (R)
These don’t look like real election results, they look like a computer algorithm
Our elections are fake


Let's be just as statistically illiterate with 2024!
THE 5% BAND
One formula fits all of it:
Harris 2024 = 0.95×Biden 2020
Trump 2024 = Trump 2020+0.05×Biden 2020
For every 1,000 Biden points, 955 stayed Democrat.
Variation explained: 🚨99%🚨
Proof! A higher R2! Rigged!


THE 15% BAND
Look at this chart.
59 races. Senate and governor.
States ordered from reddest to bluest in 2024.
The solid lines are 2024.
The dashed lines are 2026.
The shaded bands are what moved.
One formula fits all of it:
Republican 2026 = 0.85 × Trump 2024
Democrat 2026 = Harris 2024 + 0.15 × Trump 2024
For every 1,000 Trump points, 850 stayed Republican. 150 landed on the Democratic side.
The numbers:
Senate: Republicans kept ~85% of Trump’s share
Governor: ~86%
Variation explained: 88%
What makes it strange:
It didn’t matter how red the state was. Wyoming, Ohio, Illinois, Massachusetts: same 15% (p = 0.69). The Democratic gain was sized by Trump’s vote, not Harris’s. The Harris part is zero.
The 0.85 beat both standard election-swing models in every set of races.
Drop any single state and the multiplier stays between 0.846 and 0.853.
Why seats flipped:
At 0.85, any state where Trump got under about 58.5% falls below 50%. Texas, Kansas, Iowa, Ohio, South Carolina, North Carolina: all under that line. All flipped.
What this means:
Midterms are messy. This one isn’t. Two sets of races, different candidates, different campaigns, and the same 15% decrease almost everywhere.
A pattern this even demands answers at the ballot level: paper ballot hand counts, poll-book check-ins against votes counted, and voter files showing who actually turned out.
The numbers raise the question.
The ballots can answer it.

And: “THE VOTE SHIFTED AGAINST Rs ROUGHLY THE SAME EVERYWHERE PLUS OR MINUS SEVERAL POINTS IN A HOSTILE NATIONAL ENVIRONMENT MUST BE 🚨🚨🚨FRAUD🚨🚨🚨”
HOLY SH*T 🚨 The post below goes over the Midterms election results and shows it was algorithmically rigged, I put it into artificial intelligence AND AI CONFIRMS IT’S CORRECT. THE FRAUD ALGO AND ELECTION RESULTS PERFECTLY MATCH
“We cracked their cheating algorithm. 85/15 algorithm....for every 1000 Trump votes (most likely during early voting when Dems front loaded everything) 150 switched to Dems. It's the same pattern in every state that went blue”
Check the AI screenshot. It confirms the math is correct to the results that came in


1
1
85

So apparently in the grasping-at-straws election denialist community, the new hott arguments are:
1. Holy cr*p the partisan breakdown in all the races is remarkably similar it must be FAKE
2. Look the famously disliked R candidate got fewer votes than other R candidates NO WAY


45
Mark Friesen retweeted

Just so I understand: You're suggesting that Republicans, who have controlled every statewide elected office in Texas for more than 30 years, rigged an election against themselves?

This is predictably getting some traction in the election conspiracy fever swamps. Here’s what they’re trying to do: “🚨🚨🚨36,530 new people! (foreigners probably!) But 263,459 new voters! Numbers don’t match! FRAUD!!!🚨🚨🚨”
No, it’s math. 1/6

Oregon had a net population gain of 36,530 since 2020 - 100% of which are international immigrants.
Yet, in that same time period registered a net gain of 263,459 new "voters."
👀Look:
The first image is a chart of Oregon's net population change since April 2020.
Since then, net migration is flat at -670. International immigration is staggering at +56,700. The birth / death ratio is also alarming at -19,500. The net population gain is +36,530.
The 36,530 net population gain is ALL INTERNATIONAL IMMIGRANTS.
Now, look at the next two images. It's the growth, year over year, of active registered voters in Oregon since 2020 and the current stated active registered voters for this 2026 mid-term election - straight from the Oregon SOS website.
We've had a population increase of 36k international immigrants, since 2020, with 263,459 new active voter registrations in the same time period.
How?
Tell me: how exactly can voter registrations grow 700% larger than population growth of made up of 100% non-citizens?
None of this is believable. None of this is legit.


But that’s not the only source of new voters. In 2020 there were 309,000 unregistered eligible voters. A sizeable pool to draw from. In Nov. 2024 there were 197,000. So in those 4 years that pool was drawn down by 112,000. 5/6
1
39